Can you believe it is already October?! Hopefully your students have gotten into the groove of taking an online course, and you’re enjoying the teaching process.
Canvas, our learning management system (LMS) offers ways for instructors to track and analyze what students are doing in a course. This possibility assists instructors with helping students to achieve success in their courses. How does it do this? The thought of viewing analytics can be overwhelming at times. We know Canvas collects a lot of data, but how can we access and utilize it efficiently while actively teaching a course?
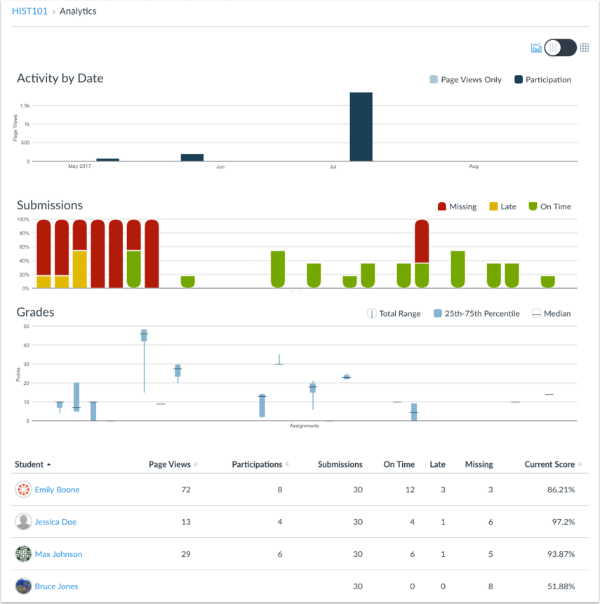
This Canvas guide shares there are four types of analytics available and four ways to use course analytics.
In course analytics, there are four main sections:
- Activity allows the instructor to see when students view a page or participate in the course.
- Submissions allows the instructor to view if students submit assignments on-time, late, or not at all.
- Grades use a box and whisker plot to show the distribution of grades in the course.
- Student Analytics shows page views, participation, assignments, and current score for every student in the course.
Use course analytics to:
- Predict how students react to course activities.
- See which students are at-risk and need help.
- View how effective your teaching strategies are in allowing students to learn.
- See a quick view of what your students are achieving in your course.
Hopefully this blog post has you convinced you that Canvas analytics are awesome! You can learn more about the specifics by contacting our team, or by viewing the guides below.
- How do I view Course Analytics?
- How do I view analytics for a student in a course?
- FGCU eLearning Canvas Resources
- Dartmouth University has developed a free online course called “Analytics in Course Design: Leveraging Canvas Data”.
Please let us know if you are currently using analytics in an innovative and useful way. We’d love to highlight your success stories on this blog.